Convert your text into an interactive Knowledge Graph
When reading lengthy or intricate texts, keeping an overview of different dependencies within the context is crucial. Traditionally, humans achieve this through note-taking or mentally creating a concept map.
Now imagine having AI at hand which generates such a map for you. Even better, the map is interactive and enables you to explore complex relationships between characters, locations, or events.
Rahul Nayak accomplished this using Large Language Models (LLMs). He divides texts into segments and has an LLM convert these into a list of pairwise terms and their relationships.
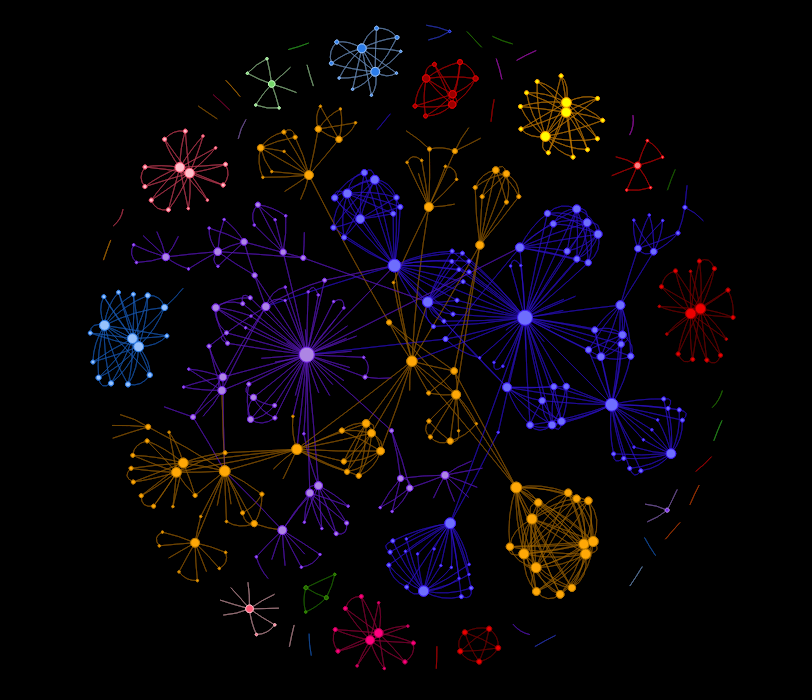
Curious, I tried it myself, indexing the first 14 chapters of Moby Dick. The result is the beautifully colored graph you see in the title imgage. shown below.
Click this link to explore the graph yourself.Simply scroll your mouse to zoom in or click on a node to have relations highlighted and move it around.
Notably, Queequeg emerges as a significant node, indicating his importance to the story. The graph also includes numerous links to terms related to destiny. Thus, just exploring the graph, allows us to grasp a core theme of the novel without having read a single page of the book.
Some constructive critique
While LLMs easily identify concepts and terms of the given text, summarizing relevant relations poses challenges. Mostly the summary is too long and not every relation provided is relevant from the overall perspective.
Additionally, the computational expense is notable. Generating a graph for all 135 chapters of Moby Dick will take approximately 1.5 hours.
In both cases I assume, improvements in LLMs to overcome these shortcomings in the near future.
Summary
In conclusion, despite existing limitations, this approach shows promise with potential applications where ever visualizing context related relations helps with managing text.
In addition to visualizing character relationships in books and stories, quality control for corporate texts could be an interesting field for application.
For the technical enthusiasts, a few more details to Rahul's approach:
Extraction of Concepts and Semantic Relationships:
Starting with text chunking, Rahul asks the LLM to extract concepts and their relations from the text in JSON.Network Graph Construction:
Using NetworkX, the JSON data is used to constructs a graph of concepts. Interpretability is enhanced by incorporating a community detection algorithms which color-codes nodes.Graph Visualization:
Finally Pyvis is used for visualizing the constructed graph.

